

There was a post recently about running a static code analysis tool on Qt 5 with some rather cute results. The main purpose of the post is to advertise the tool used, but it does make a nice point of how careless we can be when writing the code.
Since KDE is a Free/Open project, we don’t usually have the necessary finances in order to be able to use the tools like the one linked above. Fortunately, not all is grim. The great people at Clang, apart from making one of the best C++ compilers, provide us with a few tools as well.
I’ve written about clang-format some time ago. Now, it is the time for another, a bit younger project - Clang Analyzer.
What is it?
The Clang Static Analyzer is a source code analysis tool that finds bugs in C, C++, and Objective-C programs. The analyzer is 100% open source and is part of the Clang project. Like the rest of Clang, the analyzer is implemented as a C++ library that can be used by other tools and applications. ~ from the project’s website
It tries to analyze the different execution paths of your code and try to detect whether some of them can lead to problems.
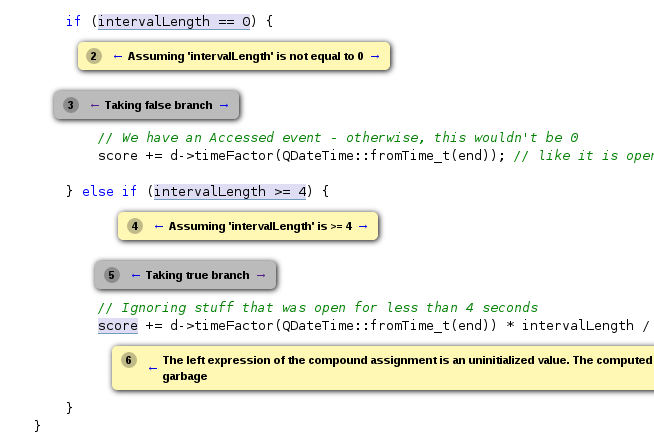
As an example, I’ve used it on KActivities. And I got a false-positive, but a very reasonable false-positive. Namely, one variable was not initialized when declared, and as far as the analyzer is concerned, it might have been left uninitialized till its insertion into sqlite.
In reality, it was initialized in a range-for loop which is guaranteed to have at least one iteration, which the analyzer could not have known. It took me more than a minute to explain to myself that the variable can not be uninitialized, so I can not blame the the static analysis for the false alarm.
How to use it?
At the moment, it does not have a very sophisticated mechanism of execution. It follows the usual pattern of wrapping the compiler commands (similar to icecream, colorgcc etc.).
You need to set your build to use the wrapper instead of the actual compiler.
Lets say that you have installed Clang to /usr/local and copied the llvm/tools/clang/tools/ directory to /usr/local/share/clang/ (the analyzer is not installed by default, so you need to copy it manually).
You can create a separate build directory (in my case /opt/kf5/build-analyzer/path/to/your/project) and invoke cmake from there like this:
cmake /path/to/your/project's/sources \
    ...options you normally pass to cmake ... \
    -DCMAKE_CXX_COMPILER=/usr/local/share/clang/tools/scan-build/c++-analyzer
After cmake finishes its magic, run the analyzer:
/usr/local/share/clang/tools/scan-build/scan-build \
    --use-analyzer=/usr/local/bin/clang++ make
It will compile your project and analyze it at the same time. It will take much more time than an ordinary compilation run, but that is to be expected because of all the additional work it does.
To see the results, you need to run the scan-view command which will start a small web-server and point your web browser to it. You’ll be able to browse the detected issues from there. It nicely displays the sequence points that lead to the detected problem.


